Geolocation is the process of identifying the geographic location of an object such as a mobile phone or a computer. Twitter allows its users to provide their location when they publish a tweet, in the form of latitude and longitude coordinates. With this information, we are ready to create some nice visualisation for our data, in the form of interactive maps.
This article briefly introduces the GeoJSON format and Leaflet.js, a nice Javascript library for interactive maps, and discusses its integration with the Twitter data we have collected in the previous parts of this tutorial (see Part 4 for details on the rugby data set).
Tutorial Table of Contents:
- Part 1: Collecting data
- Part 2: Text Pre-processing
- Part 3: Term Frequencies
- Part 4: Rugby and Term Co-Occurrences
- Part 5: Data Visualisation Basics
- Part 6: Sentiment Analysis Basics
- Part 7: Geolocation and Interactive Maps (this article)
GeoJSON
GeoJSON is a format for encoding geographic data structures. The format supports a variety of geometric types that can be used to visualise the desired shapes onto a map. For our examples, we just need the simplest structure, a Point. A point is identified by its coordinates (latitude and longitude).
In GeoJSON, we can also represent objects such as a Feature or a FeatureCollection. The first one is basically a geometry with additional properties, while the second one is a list of features.
Our Twitter data set can be represented in GeoJSON as a FeatureCollection, where each tweet would be an individual Feature with its one geometry (the aforementioned Point).
This is how the JSON structure looks like:
{
    "type": "FeatureCollection",
    "features": [
        {
            "type": "Feature",
            "geometry": {
                "type": "Point",
                "coordinates": [some_latitude, some_longitude]
            },
            "properties": {
                "text": "This is sample a tweet",
                "created_at": "Sat Mar 21 12:30:00 +0000 2015"
            }
        },
        /* more tweets ... */
    ]
}
From Tweets to GeoJSON
Assuming the data are stored in a single file as described in the first chapter of this tutorial, we simply need to iterate all the tweets looking for the coordinates field, which may or may not be present. Keep in mind that you need to use coordinates, because the geo field is deprecated (see the API).
This code will read the data set, looking for tweets where the coordinates are explicitely given. Once the GeoJSON data structure is created (in the form of a Python dictionary), then the data are dumped into a file called geo_data.json:
# Tweets are stored in "fname"
with open(fname, 'r') as f:
    geo_data = {
        "type": "FeatureCollection",
        "features": []
    }
    for line in f:
        tweet = json.loads(line)
        if tweet['coordinates']:
            geo_json_feature = {
                "type": "Feature",
                "geometry": tweet['coordinates'],
                "properties": {
                    "text": tweet['text'],
                    "created_at": tweet['created_at']
                }
            }
            geo_data['features'].append(geo_json_feature)

# Save geo data
with open('geo_data.json', 'w') as fout:
    fout.write(json.dumps(geo_data, indent=4))
Interactive Maps with Leaflet.js
Leaflet.js is an open-source Javascript library for interactive maps. You can create maps with tiles of your choice (e.g. from OpenStreetMap or MapBox), and overlap interactive components.
In order to prepare a web page that will host a map, you simply need to include the library and its CSS, by putting in the head section of your document the following lines:
<link rel="stylesheet" href="http://cdnjs.cloudflare.com/ajax/libs/leaflet/0.7.3/leaflet.css" />
<script src="http://cdnjs.cloudflare.com/ajax/libs/leaflet/0.7.3/leaflet.js"></script>
Moreover, we have all our GeoJSON data in a separate file, so we want to load the data dynamically rather than manually put all the points in the map. For this purpose, we can easily play with jQuery, which we also need to include:
<script src="http://code.jquery.com/jquery-2.1.0.min.js"></script>
The map itself will be placed into a div element:
<!-- this goes in the <head> -->
<style>
#map {
    height: 600px;
}
</style>
<!-- this goes in the <body> -->
<div id="map"></div>
We’re now ready to create the map with Leaflet:
// Load the tile images from OpenStreetMap
var mytiles = L.tileLayer('http://{s}.tile.osm.org/{z}/{x}/{y}.png', {
attribution: '© <a href="http://osm.org/copyright">OpenStreetMap</a> contributors'
});
// Initialise an empty map
var map = L.map('map');
// Read the GeoJSON data with jQuery, and create a circleMarker element for each tweet
// Each tweet will be represented by a nice red dot
$.getJSON("./geo_data.json", function(data) {
var myStyle = {
radius: 2,
fillColor: "red",
color: "red",
weight: 1,
opacity: 1,
fillOpacity: 1
};
var geojson = L.geoJson(data, {
pointToLayer: function (feature, latlng) {
return L.circleMarker(latlng, myStyle);
}
});
geojson.addTo(map)
});
// Add the tiles to the map, and initialise the view in the middle of Europe
map.addLayer(mytiles).setView([50.5, 5.0], 5);
A screenshot of the results:
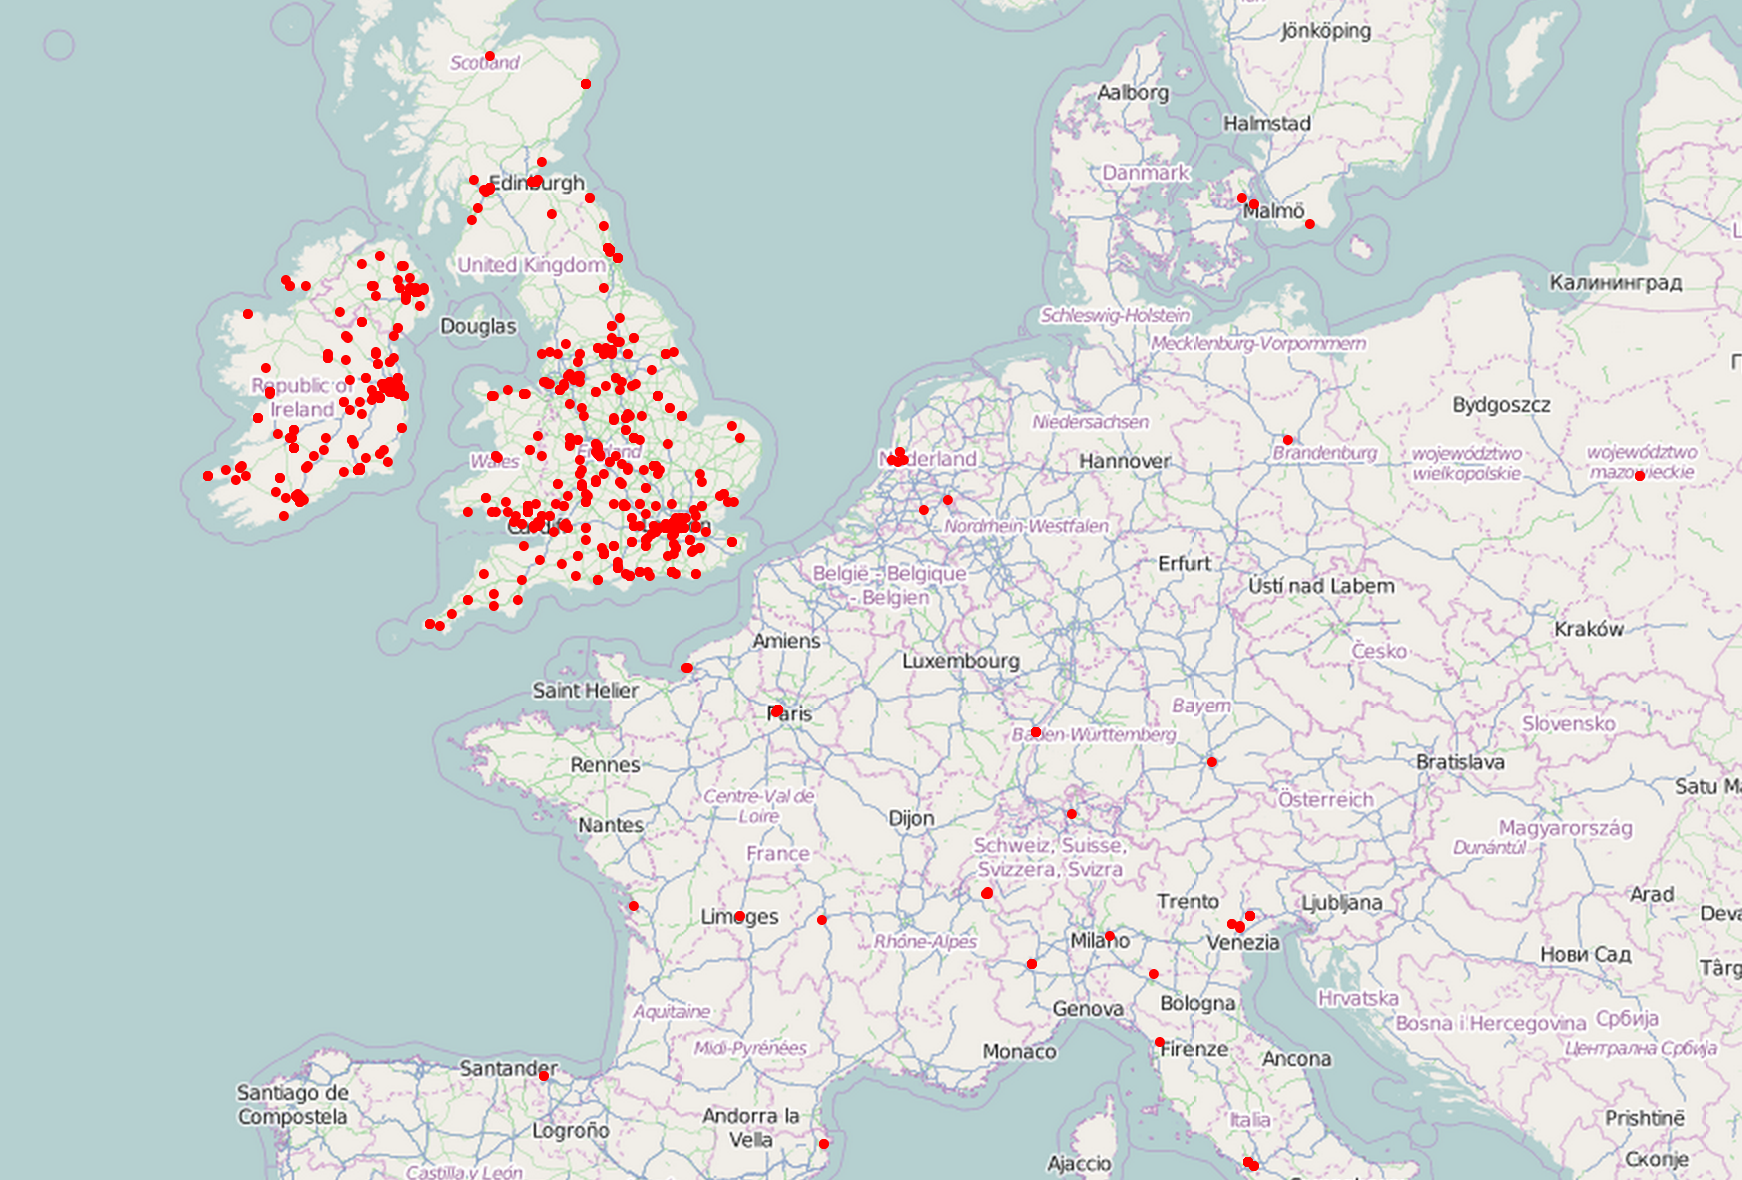
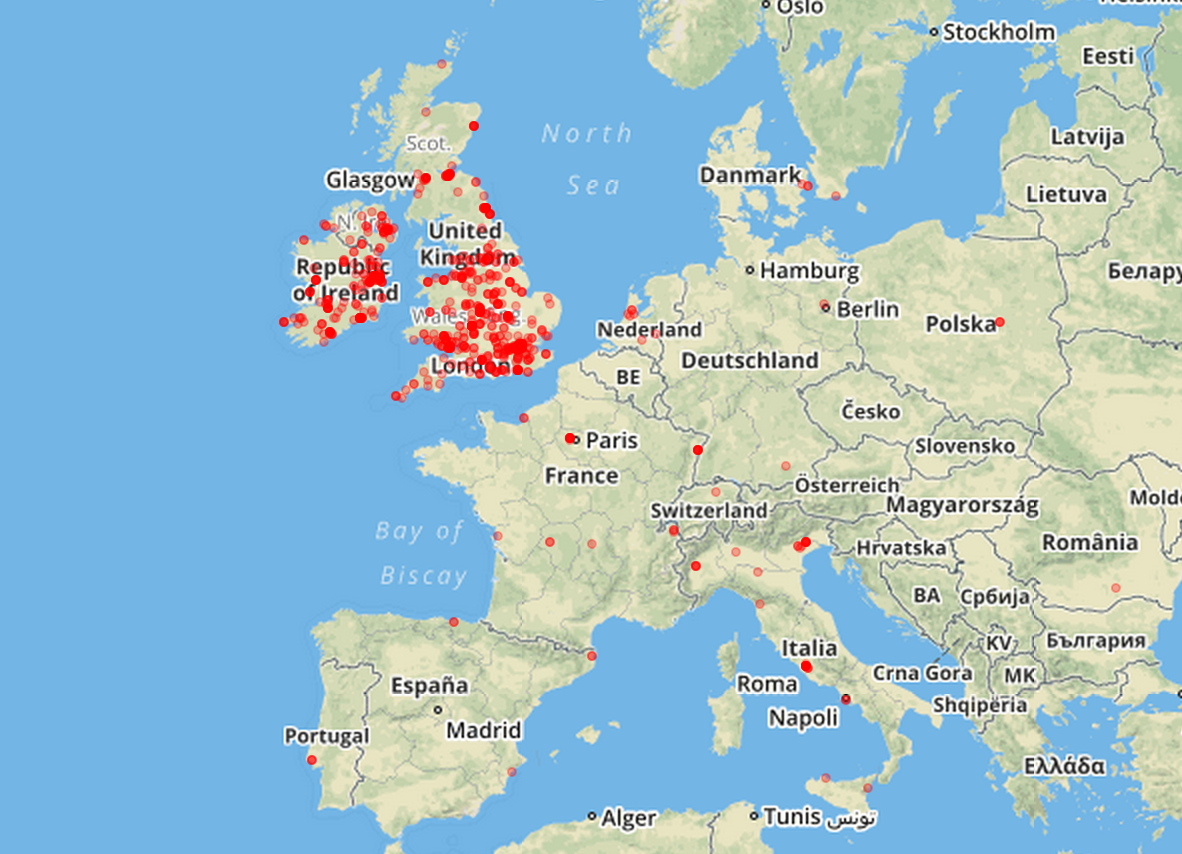
The above example uses OpenStreetMap for the tile images, but Leaflet lets you choose other services. For example, in the following screenshot the tiles are coming from MapBox.
You can see the interactive maps in action here:
Summary
In general there are many options for data visualisation in Python, but in terms of browser-based interaction, Javascript is also an interesting option, and the two languages can play well together. This article has shown that building a simple interactive map is a fairly straightforward process.
With a few lines of Python, we’ve been able to transform our data into a common format (GeoJSON) that can be passed onto Javascript for visualisation. Leaflet.js is a nice Javascript library that, almost out of the box, lets us create some nice interactive maps.
Tutorial Table of Contents:
- Part 1: Collecting data
- Part 2: Text Pre-processing
- Part 3: Term Frequencies
- Part 4: Rugby and Term Co-Occurrences
- Part 5: Data Visualisation Basics
- Part 6: Sentiment Analysis Basics
- Part 7: Geolocation and Interactive Maps (this article)

Nice Post !!!! :)
LikeLike
what are the things that you can do with twitter data once its collected
LikeLike
Very nice article, thanks man!
LikeLike
Where’s the code located? Do you have a github repository or something?
LikeLike
Hi jonas, all the code you need to replicate the examples is embedded in the article. The data have been collected using the code from part 1 and the description of the data is on part 4.
Cheers,
Marco
LikeLike
Hi I tried following your instructions and initially it worked out well. I was even able to plot it in a map. However, as I stream more twitter data, I’m unable to run due to this keyerror: line 15, in
if tweet[‘coordinates’]:
KeyError: ‘coordinates’
any advise please?
LikeLike
From some tests, every tweet has a “coordinates” field which might be empty. I suspect this could be a problem of data integrity. If you see some of your tweets without the coordinates field at all, you can change that line with:
if tweet.get(‘coordinates’):
# will return None if tweet[‘coordinates’] does not exist, hence it won’t break
Cheers,
Marco
LikeLike
Within the past day, I streamed a 200 MB file of tweets containing #WT20 , which is an ongoing cricket tournament in Mumbai, however using these instructions only 54 tweets contained coordinates. That seems a bit low, any idea?
with open(‘data.json’, ‘r’) as f:
geo_data = {
“type”: “FeatureCollection”,
“features”: []
}
for line in f:
tweet = json.loads(line)
if tweet.get(“coordinates”, None) is not None:
print(tweet[‘coordinates’])
print(count)
geo_json_feature = {
“type”: “Feature”,
“geometry”: tweet.get(‘coordinates’),
“properties”: {
“text”: tweet[‘text’],
“created_at”: tweet[‘created_at’]
}
}
geo_data[‘features’].append(geo_json_feature)
with open(‘geo_data.json’, ‘w’) as fout:
fout.write(json.dumps(geo_data, indent=4))
LikeLike
Hi Nolan, this is quite on the lower end but not too far off compared to what I’ve observed with different data sets.
LikeLike
i am unable to run the following part of the code. i am a noob when it comes to js.
http://cdnjs.cloudflare.com/ajax/libs/leaflet/0.7.3/leaflet.js
http://code.jquery.com/jquery-2.1.0.min.js
<!– this goes in the –>
#map {
height: 600px;
}
<!– this goes in the –>
// Load the tile images from OpenStreetMap
var mytiles = L.tileLayer(‘http://{s}.tile.osm.org/{z}/{x}/{y}.png’, {
attribution: ‘© OpenStreetMap contributors’
});
// Initialise an empty map
var map = L.map(‘map’);
// Read the GeoJSON data with jQuery, and create a circleMarker element for each tweet
// Each tweet will be represented by a nice red dot
$.getJSON(“./geo_data.json”, function(data) {
var myStyle = {
radius: 2,
fillColor: “red”,
color: “red”,
weight: 1,
opacity: 1,
fillOpacity: 1
};
var geojson = L.geoJson(data, {
pointToLayer: function (feature, latlng) {
return L.circleMarker(latlng, myStyle);
}
});
geojson.addTo(map)
});
// Add the tiles to the map, and initialise the view in the middle of Europe
map.addLayer(mytiles).setView([50.5, 5.0], 5);
LikeLike
Hello Marco!
I want to start by saying that this is the most useful tutorial on Twitter mining that I have seen to date! Thank you!
I only have one question. I don’t know if this is a coincidence or an error, but out of the roughly 2000 tweets, only two had valid coords. Both of these two coords were in places that I really don’t think are correct (All the way down by south pole, and in the middle of Somalia). Any indication as to why this may be happening?
LikeLike
Hi Dane, the number of tweets with geo coordinates is often very low. With such a small data set, it’s possible to have very few useful tweets.
About the coordinates, please make sure you haven’t swapped latitude and longitude: the “geo” field (now deprecated) shows [latitude, longitude], while the “coordinates” field shows [longitude, latitude]. GeoJSON requires the latter
Cheers,
Marco
LikeLike
Regarding coordinate order, the first code sample at the top of this post shows latitude then longitude. My information is that is the order Leaflet wants. See https://macwright.org/lonlat/
This is a very helpful tutorial. Thanks so much.
LikeLike
hallo, using your codes i can get the map, but it dose not show any red points on the map,
any advise? thank you so much!
LikeLike
Even I am facing the same problem. Is there any solution?
LikeLike
Hi Marco,
When I try to use your ‘From tweets to GEOJSON’ code, I get an error message saying ‘json is not defined’. To fix this, I had ‘import json’ to the start of the code. However, this just ends up giving an error message that says ‘JSONDecodeError(“Expecting value”, s, err.value) from None
json.decoder.JSONDecodeError: Expecting value: line 2 column 1 (char 1’
Any help on how to fix this is greatly appreciated. Many thanks.
LikeLike
Hi Michael, can you check out the comment here: https://marcobonzanini.com/2015/03/09/mining-twitter-data-with-python-part-2/#comment-1140
the problem seems very similar — let me know if it solves the problem.
Cheers,
Marco
LikeLike
Marco,
Thank you that appeared to work. However, after gathering 100mb of tweets over ten minutes using the keyword ‘Trump’ (wanted to gather a large volume of tweets so used this word). only about 10 of the tweets were included in the file created by the tweets to Geo code you have in section 7. Furthermore, when I ran these coordinates, they all corresponded to random locations around the world (Antarctica. the coast of Equatorial Guinea) – locations that are unlikely to be where the tweet was actually sent from.
Thanks again, for all of your help. You have provided a novice like me with a lot of insight.
LikeLike
Marco, I see that you have already responded to a very similar question. Apologies for the time wasting.
LikeLike
Cheers Michael, no worries, it’s good to have feedback from reader. Regarding the number of tweets with coordinates, it’s always small compared to all the tweets you collect, as users have to actively opt in to share their location. With 100 Mb you’ll have approx 25k tweets, so I’d expect to see more than 10 tweets with coordinates, yet this happens on occasions with small data sets.
Cheers,
Marco
LikeLike
Hey Marco… can’t believe I made it up to this point following your examples… When I first saw this blog I thought there is no way I can get all this stuff to work… and Although I haven’t managed to get all of it working 100%, I’ve still managed to learn tons in just 1 week… thanks to your simple and clear explanations, and some of the user comments. Thank you!
About the coordinates field being null, is there a way to map tweets on a map based on the user’s location settings? I know this will be far from accurate but should still be useful.
LikeLike
Hi Mandla
you can look into one of the geocoders available, e.g. geopy or pygeocoder. I don’t have much experience in this direction, so I don’t have a specific suggestion. Usually what these tools do is taking a location/address and return latitude/longitude through a call to some mapping API like Google Maps or OpenStreetMap (there might be rate limits etc.)
Hope this help,
Cheers
Marco
LikeLike
Hello Marco!
Do you have any solution to make a heat map with lat and long?
LikeLike
Hi,
I haven’t used heat maps with geo data I’m afraid, but there are tools that support heat maps, for example folium (side note, now I’d recommend folium to generate maps, rather than a custom JS implementation). I’ve used folium for the map examples in my book (chap 03): https://github.com/bonzanini/Book-SocialMediaMiningPython you can probably adapt one of the examples using the heat map plugin
Cheers,
Marco
LikeLike
pllz pour la partie de la map , le code vous le mettez où et comment vous arrivez à mettre les balises de script dans le head de la page? je ss tjs débutante
LikeLike
Hi kawtar,
not sure I fully understand your question because my French is limited. Firstly you create the GeoJSON file from your tweets using the Python code shown above. Secondly you create a web page which embeds such GeoJSON. This web page is a plain old html file that you create manually. You have two examples linked just before the final summary, which you can essentially copy and modify for your style needs. If this doesn’t answer your question, please rephrase in English
Cheers,
Marco
LikeLike
Hi, Thanks so much for the tutorial, huge help! Just have a question, I can’t get the map to load :( The geo_data file is fine, it all works up to there, it must be a problem with the HTML/JS. The page just comes up blank, with no error. The following is my html/JS code, literally just copied from yours:
http://cdnjs.cloudflare.com/ajax/libs/leaflet/0.7.3/leaflet.js
http://code.jquery.com/jquery-2.1.0.min.js
#map {
height: 600px;
}
// MAP STUFF
// Load the tile images from OpenStreetMap
var mytiles = L.tileLayer(‘http://{s}.tile.osm.org/{z}/{x}/{y}.png’, {
attribution: ‘© OpenStreetMap contributors’
});
// Initialise an empty map
var map = L.map(‘map’);
// Read the GeoJSON data with jQuery, and create a circleMarker element for each tweet
// Each tweet will be represented by a nice red dot
$.getJSON(“./geo_data.json”, function(data) {
var myStyle = {
radius: 2,
fillColor: “red”,
color: “red”,
weight: 1,
opacity: 1,
fillOpacity: 1
};
var geojson = L.geoJson(data, {
pointToLayer: function (feature, latlng) {
return L.circleMarker(latlng, myStyle);
}
});
geojson.addTo(map)
});
// Add the tiles to the map, and initialise the view in the middle of Europe
map.addLayer(mytiles).setView([50.5, 5.0], 5);
LikeLike
You can the see the code here, so you can get a better idea.
view-source:http://bonzanini.github.io/mining-twitter/rugby-osm.html
LikeLike
Go to above link in chrome browser. Right click on web page and choose view source. You will see the source code.
LikeLike
Hi, great tutorial!
I just have a question – I have encountered an error which is:
if tweet[‘coordinates’]:
TypeError: list indices must be integers, not str
Which I can’t seem to shake, any ideas?
Many thanks!
LikeLike
Hi Rachel
for some reason your tweet object is a list rather than a dictionary. The data file is expected to have one tweet per line in json format, with no empty lines. In this way json.loads() can load up the tweet dictionary. So possibly some data integrity problem?
Cheers,
Marco
LikeLike
Hi Marco,
This is an amazing tutorial. I have completed my work within a week with the help of this tutorial. Thank for making it simple and clear. I just wanted to know, how can I extend this example further. Please give me some suggestion.
LikeLike
Hi, glad you liked it. Please have a look at the material for my book (the code is free), in particular chapters 2 and 3 are about Twitter: https://github.com/bonzanini/Book-SocialMediaMiningPython
Cheers,
Marco
LikeLike
Hi Marco
Thank you for your great tutorials and book.
I’m running exactly your code from your book for the file twitter_make_geojson.py but the content in the output file is ever the same
{
“type”: “FeatureCollection”,
“features”: []
}
so it is empty, depite the input file contains information as
“url”:”https:\/\/api.twitter.com\/1.1\/geo\/id/77d45fff09fe6f8a.json”,”place_type”:”city”,”name”:”Ju\u00e1rez”,”full_name”:”Ju\u00e1rez, Chihuahua”,”country_code”:”MX”,”country”:”M\u00e9xico”,”bounding_box”:{“type”:”Polygon”,”coordinates”:[[[-106.950638,31.120681],[-106.950638,31.783867],[-106.185378,31.783867],[-106.185378,31.120681]]]},
Some help/advice ?
Thank you in advance
Diego Gachet
LikeLike
Hi Diego
could you check if that particular tweet has the attribute “coordinates” at the first level? The example of json you’re pasting shows the attribute “place” (which then has its own “coordinates”, but it’s a polygon not a point). Reference: https://developer.twitter.com/en/docs/tweets/data-dictionary/overview/tweet-object
Cheers
Marco
LikeLike
Thank you Marco, that is the problem. In fact in a 2000 tweets file only 6 has the “coordinates” attribute.
LikeLike
Hi Marco,
This is an excellent and straightforward tutorial.
Very good job, thanks a lot.
LikeLike
Hi Marco,
This book is so useful and exciting !! Thanx.
While running the codes obtained in your paperbook, the twitter_make_geojson.py works great on user profiles but when I try to apply it on a jsonl file I’ve collected with a custom stream listener – like you did with the Rugby World Cup 2015 final example – I get the following error :
Traceback (most recent call last):
File “C:\etc\twitter_make_geojson.py”, line 26, in
tweet = json.loads(line)
File “C:\Users\etc\AppData\Local\Programs\Python\Python36-32\lib\json\__init__.py”, line 354, in loads
return _default_decoder.decode(s)
File “C:\Users\etc\AppData\Local\Programs\Python\Python36-32\lib\json\decoder.py”, line 339, in decode
obj, end = self.raw_decode(s, idx=_w(s, 0).end())
File “C:\Users\etc\AppData\Local\Programs\Python\Python36-32\lib\json\decoder.py”, line 357, in raw_decode
raise JSONDecodeError(“Expecting value”, s, err.value) from None
json.decoder.JSONDecodeError: Expecting value: line 2 column 1 (char 1)
Any hint about why Python raises this error ?
Thanx. Cheers.
LikeLike